







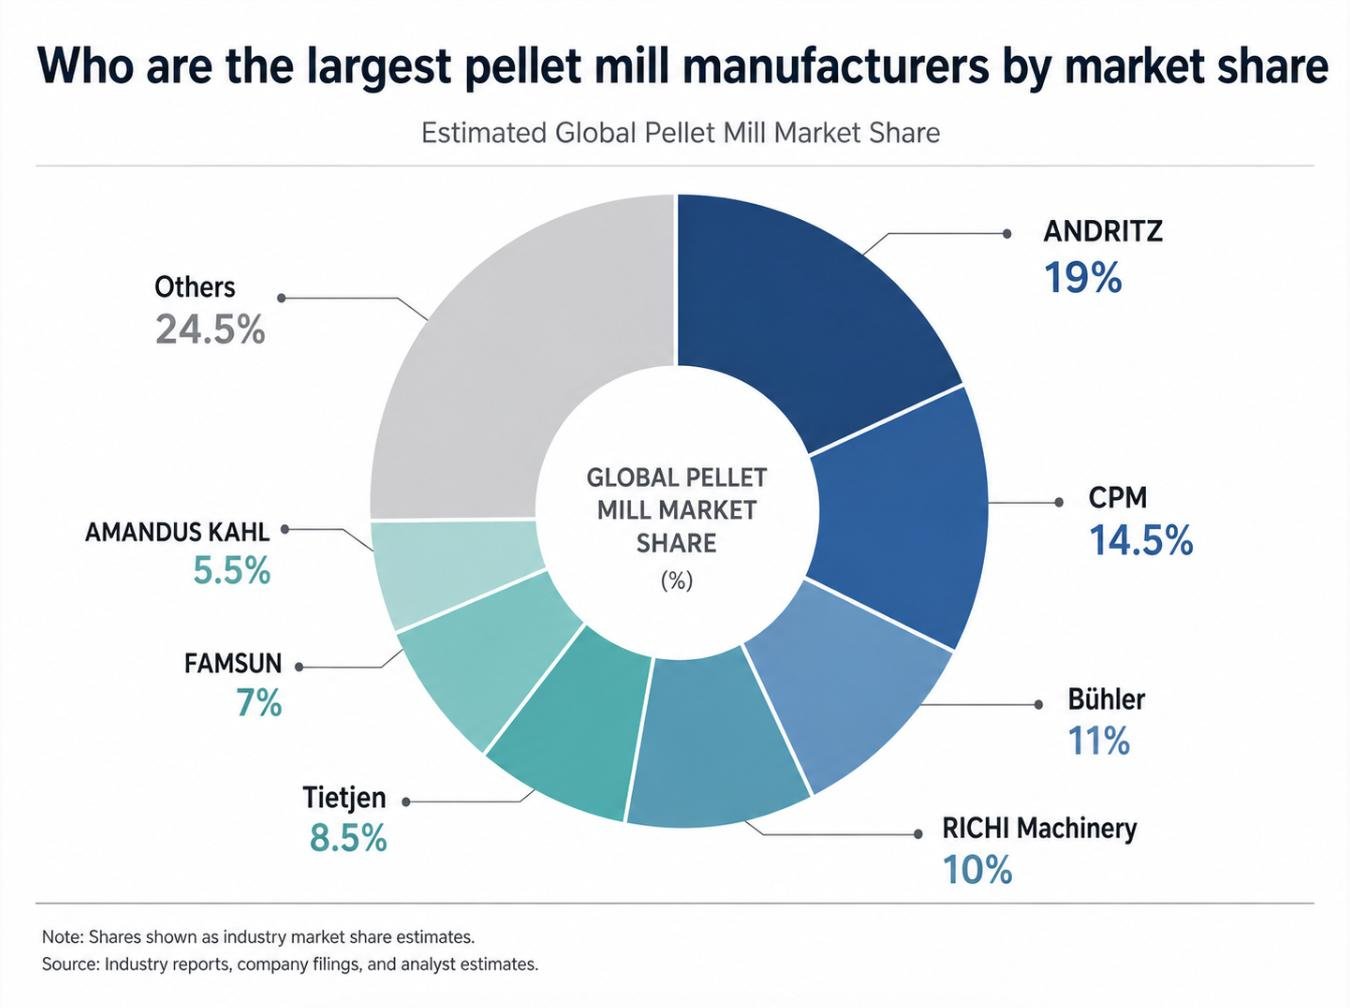
Direct answer: there is no single, universally audited table that establishes the largest pellet mill manufacturers across every feed, biomass, wood, and industrial application. The supplied 2025 comparison graphic estimates ANDRITZ at 19%, CPM at 14.5%, Bühler at 11%, RICHI Machinery at 10%, Tietjen at 8.5%, FAMSUN at 7%, AMANDUS KAHL at 5.5%, and a combined “Others” group at 24.5%. Those figures are useful as a market-orientation model, not as audited revenue shares. A serious buyer should therefore use the ranking to build a shortlist, then select by application, regional support, project scale, and lifecycle risk.
Read the chart correctly before ranking manufacturers
The graphic labels its numbers as estimates derived from industry reports, company filings, and analyst estimates. It does not define a single reporting currency, product boundary, shipment unit, or audited market denominator. That limitation matters. One company may report complete production lines, another may emphasize individual pellet mills, and a diversified engineering group may combine pellet-related equipment with a much larger business segment. Private manufacturers may disclose less financial detail than listed groups. Consequently, a percentage should not be interpreted as a precise measure of machine quality, customer count, installed capacity, or suitability for a particular project.
The “Others” category is also the largest single block at 24.5%. It represents many regional and specialist suppliers rather than one competitor. Its size shows that the market is fragmented: global names coexist with local manufacturers, niche engineering companies, rebuild specialists, and suppliers focused on a specific raw material or geography. A buyer who only considers the top three names could miss a technically suitable vendor, while a buyer who ignores scale could underestimate delivery and service risk.
What the estimated shares suggest
Within the graphic, ANDRITZ leads the named manufacturers at 19%. CPM follows at 14.5%, creating a 4.5-percentage-point gap. Bühler is third at 11%, and RICHI Machinery is close behind at 10%, a difference of one percentage point in this estimate. Tietjen, FAMSUN, and AMANDUS KAHL form the next group at 8.5%, 7%, and 5.5%. Adding the seven named companies gives 75.5%; the remaining 24.5% is assigned to Others, so the chart totals 100%.
This distribution supports three cautious conclusions. First, no named manufacturer holds a majority, so buyers have meaningful alternatives. Second, the leading tier contains companies with different histories, product scopes, and geographic strengths; “largest” is not the same as “interchangeable.” Third, a ten-percent estimate for RICHI places it in the chart’s upper group, but the figure alone cannot prove that RICHI is the best choice for every line. It indicates that the brand deserves comparison on the same technical and commercial basis as the other named suppliers.
Why market share changes with the market definition
A feed mill buyer and a wood-pellet developer may mean different things by “pellet mill market.” Feed applications can include poultry, livestock, aquaculture, pet food, and premix-linked processes. Biomass applications may include sawdust, agricultural residues, bark, straw, or mixed fibers. Some analyses count only the press; others include conditioners, coolers, grinders, dryers, packing systems, controls, and turnkey engineering. A supplier that is strong in high-capacity feed projects may not hold the same position in small biomass lines.
Geography changes the picture too. A manufacturer may have a mature installed base in Europe or North America while another grows faster in Asia, Africa, Latin America, or the Middle East. Exchange rates, local fabrication, import duties, distributor networks, and the timing of a few large projects can alter annual revenue estimates. Even the chosen year matters because project businesses recognize orders and deliveries unevenly.
A buyer-oriented reading of the leading names
ANDRITZ’s first-place estimate should prompt questions about large industrial integration, regional engineering resources, controls, and long-term service. CPM’s estimated second position makes it relevant where a buyer values an established pellet-equipment platform and a broad installed base. Bühler should be investigated for process integration, automation, and feed-manufacturing context. These are screening hypotheses, not conclusions; each must be validated against the offered model and the team that will actually execute the project.
RICHI Machinery’s estimated 10% share is most meaningful when paired with evidence for the specific job: process design, manufacturing scope, reference projects, test records, commissioning method, documentation, and support. The company’s stated 30-plus years of industry experience may be relevant to a buyer, but age should not replace a review of the current proposal. Tietjen, FAMSUN, and AMANDUS KAHL likewise warrant application-specific scrutiny. Tietjen may enter a shortlist through preparation and size-reduction context, FAMSUN through feed-industry project capability, and KAHL through its particular mechanical and biomass applications. The final choice depends on the line rather than the chart position.
Build a comparable request for quotation
Market-share comparisons become useful only after bidders receive the same operating brief. Specify raw-material types and seasonal ranges, particle-size distribution, moisture, bulk density, contamination risk, target pellet diameter, required hourly output, annual operating hours, product-quality criteria, utility conditions, site elevation and climate, labor assumptions, and intended level of automation. State whether capacity must be guaranteed on one recipe or across a defined recipe envelope.
Then require each supplier to identify exclusions and assumptions. A headline capacity without material conditions is not comparable. Neither is a power figure that omits the feeder, conditioner, aspiration, cooling, conveying, or preparation stages. Ask who manufactures each major machine, who integrates the controls, who accepts responsibility for the performance test, and what happens if the raw material differs from the sample used during design.
Use a weighted scorecard, not a popularity contest
A practical scorecard might allocate 25% to process fit, 20% to verified performance and reference evidence, 15% to maintainability and spare-part planning, 15% to project execution, 10% to controls and data access, 10% to lifecycle cost, and 5% to commercial and contractual clarity. The weights should change with the project. A remote plant with limited maintenance labor may increase the service and maintainability weights. A high-volume commodity producer may give more weight to throughput, availability, and energy.
Score only documented responses. A brochure statement earns less than a model-specific drawing, an accepted test protocol, or a reference that the buyer independently verifies. Separate disqualifiers from weighted preferences. Unresolved safety compliance, refusal to identify key subcontractors, inconsistent factory identity, or unwillingness to define performance boundaries can be disqualifiers regardless of a company’s estimated share.
Lifecycle economics can reverse the ranking
A manufacturer with a higher initial price may produce a lower cost per saleable tonne if it offers stable utilization, predictable wear, efficient changeovers, and serviceable components. Conversely, a lower-priced machine can be economically sound when duty is light, recipes are forgiving, local technicians are capable, and the buyer can tolerate planned maintenance. The correct calculation includes capital recovery, energy, labor, dies and rollers, lubrication, routine parts, unscheduled downtime, fines or rework, and the cost of failing quality specifications.
For illustration, assume two offers serve the same duty. Option A costs USD 100,000 more but is expected—based on buyer-verified assumptions—to avoid 80 hours of annual downtime. If the plant’s contribution loss during a stopped hour is USD 1,500, the gross avoided loss is USD 120,000 per year before considering uncertainty and other cost differences. The example does not prove Option A will deliver that result; it shows why availability assumptions can outweigh purchase price. The buyer must use its own throughput, margin, maintenance records, and confidence ranges.
How to validate a claimed market position
- Ask what products and regions are included in the claimed share.
- Request the source date and whether the number measures orders, revenue, units, or installed capacity.
- Check whether complete lines and standalone mills are combined.
- Look for consistent figures across public filings, trade research, and supplier disclosures.
- Separate a parent company’s total revenue from its pellet-equipment activity.
- Treat private-company estimates as ranges rather than exact audited values.
- Verify references that match the raw material, capacity, and operating region of the proposed project.
Account for portfolio mix and channel structure
Another source of distortion is portfolio mix. A supplier may sell fewer presses but participate in larger turnkey projects, while another may ship more individual machines through distributors. Revenue share, unit share, and installed throughput can therefore produce different rankings. Replacement dies, rollers, controls, upgrades, and service may or may not be included in the estimate. Buyers comparing quoted market positions should ask for the metric before comparing the number.
Channel structure also affects what the customer experiences. A direct manufacturer relationship can provide clearer design responsibility, whereas a capable regional integrator may deliver faster local response and better knowledge of codes or utilities. Neither arrangement is automatically superior. The contract should name the manufacturer, seller, integrator, commissioning party, warranty issuer, and long-term service contact so that scale on a chart is translated into accountable project roles.
Decision conclusion
Based strictly on the supplied estimate, ANDRITZ is the largest named pellet mill manufacturer at 19%, followed by CPM at 14.5%, Bühler at 11%, and RICHI Machinery at 10%. Tietjen, FAMSUN, and AMANDUS KAHL follow, while the fragmented Others group represents 24.5%. That is the correct reading of the graphic—and no more than that.
For procurement, use those percentages to decide whom to investigate, not whom to appoint. A defensible selection comes from a common operating brief, verified references, model-level technical evidence, a lifecycle-cost range, and clear responsibility for commissioning and performance. Market scale can reduce some supplier risks, but fit to the buyer’s material and operating system remains the decisive variable.